Sunday 17 April 2016

Human Population: The Future

  • Human population has become a concern because of the Earth becoming overpopulated
  • Larger amount of people equals more of a demand of natural resources (clean air, land, and water)
Supply and Demand
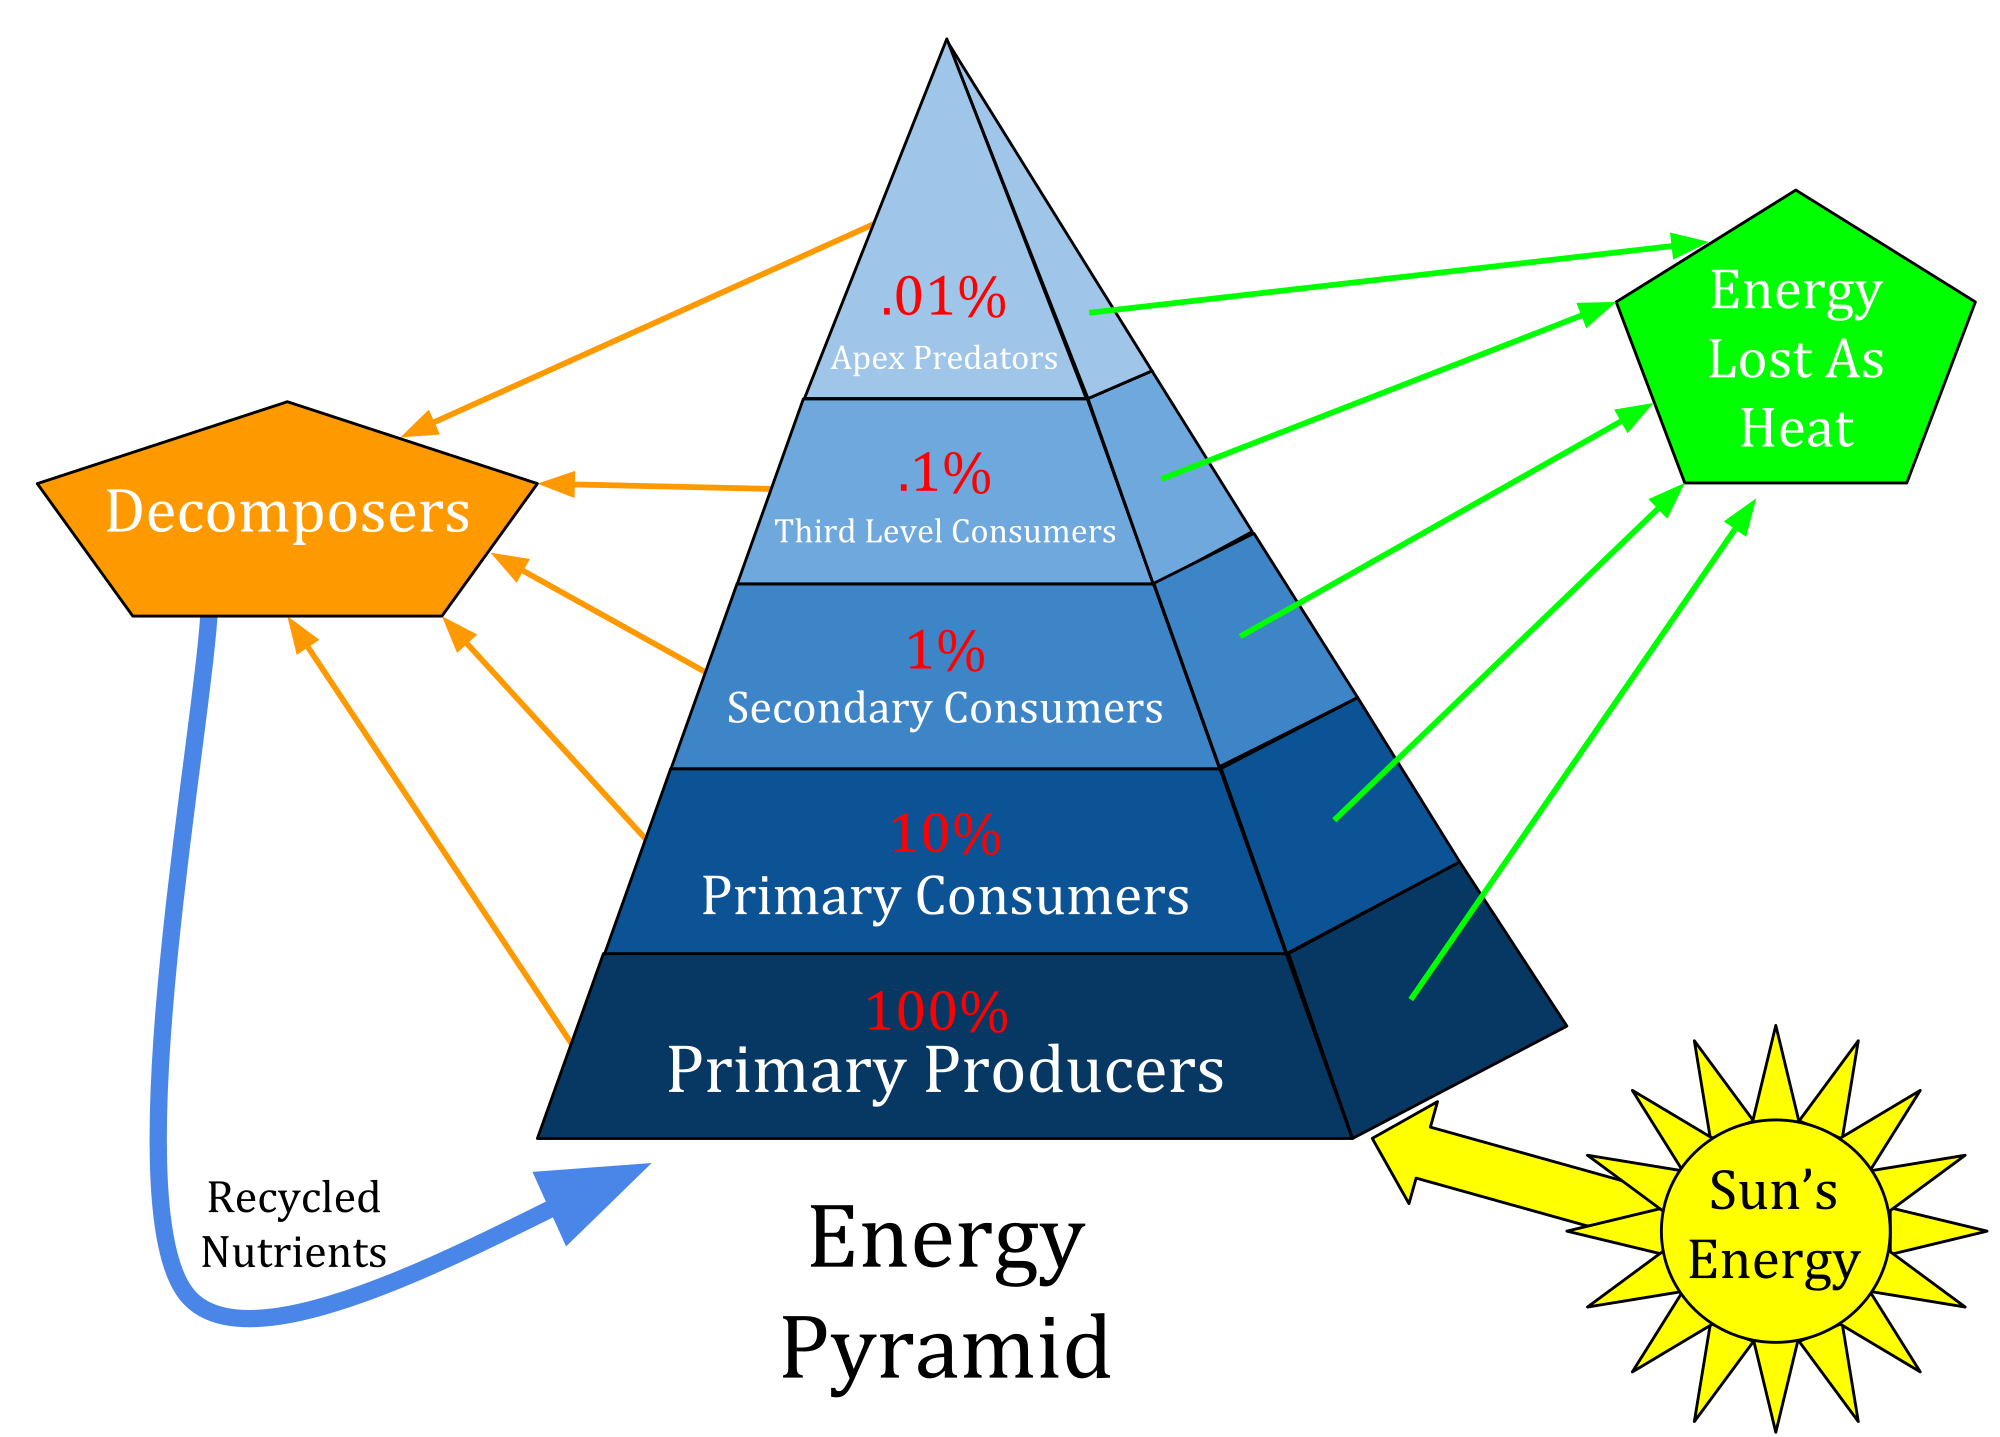
  • Earth’s natural ecosystem supplies all species with food, water, shelter
  • Population increases in size and so do their demands for resources
  • (Goes mainly for humans) As their standards of living increases, it puts natural resources into further drains
  • Reasons people consider their use of natural resources:
  • Many resources (such as notably metals and fossil fuels) are possibly running out
  • Pollution and degradation and conversion of land are reducing the renewal of resources
  • When a population exceeds its carrying capacity, two things happen; mortality rates increase and birth rates decrease
  • Today, it takes Earth a year and six months to regenerate the resources we use up in one year, if this continues, we will need the equal amount of two Earths to support us
  • If we continue turning resources into waste faster than the Earth can turn waste into resources, we could end up in an ecological deficit
Ecological Deficit: Resources use and waste production that exceeds a sustainable level
  • Earths total biocapacity is dependent on available bioglobal hectares (biocapacity is measured in units called global hectares{gha})
Biocapacity: Measure of an ecosystem’s ability to produce useful biological materials and to absorb waste materials created by humans

  • Biocapacity is dependent on natural conditions and how land is used ( example: for farming or forestry)
  • “Global hectare per person” refers to the amount of biologically produced land and water is available per person
  • If land is degraded, more land is needed to support every person and biocapacity goes down, however, if we can produce more food in a sustainable manner than Earth’s biocapacity increases
  • Concept of ecological footprint was developed at the University of British Columbia in 1990 and it measures the land and water area that a human population requires to produce the resources it consumes and to absorb its carbon dioxide emissions
  • States that our demands for resources is not sustainable
  • If our demand for resources exceeds our biocapacity, there will be an ecological deficit
Human Population Projections
  • United Nations Development Program (UNDP) released data on human fertility for 162 countries
  • Compared with 1970 to 1975, 152 countries had lower human fertility in 2000 to 2005, 3 countries showed an increase in fertility and 7 countries showed no change
  • No one can predict the future of human population but assumptions are still made 
Meeting Human Demands While Conserving Biodiversity 


  • Biodiversity is measured as the variety within species, the variety between species, and the variety of ecosystem’s
  • Species and ecosystems renew our needed resources in many ways and maintain oxygen in the atmosphere, remove carbon dioxide from the air, filter and purify water, pollinate plants, decompose wastes and transfer nutrients
  • Our demands for food, water and energy puts thousands of other species and ecosystems at risk (for example, the bird population is losing their habitats as our cities and towns expand)
  • It is estimates that about 10% of the world’s known species will be at an increasingly higher risk of extinction for every 1’C rise in temperature; some species adapt and adjust and others don’t
  • All species (including humans) depend on each other to survive and a lot of human activity impacts the survival of other species
  • We must learn how to protect Earth’s ecosystems and resources while meeting our own needs

Implications of Human Population Growth


  • Exponential expansion of the human population comes with environmental concerns 
  • Growth comes with resulting demands for resources has either caused or intensified many environmental issues including deforestation, the depletion of fish reserves, species loss, over-zealous extraction be use of fossil fuel resources, and climate change 
  • Sustainable Population: population that can survive over thousands of years without running out of resources or damaging its environmental niche 

Urbanization: 
  • More than 80% of Canadians now live in urban areas 
  • Migration occurs for several reasons 
  • Farming depends on unpredictable environmental conditions also industrialization of agriculture has reduced the number of small and medium sized farms 
  • Rural labour market has reduced this people move into cities to search for other economic opportunities 
  • As cities push outwards to accommodate their ever-growing populations, tremendous pressure is put on the land that is used to produce food
  • Changes in land use affect the water cycle and disturb or destroy 
  • Asphalt and concrete, reduce the ability of the ground to absorb water 
  • Emissions from vehicular traffic enter and pollute natural waterways, affecting both water and air quality quality of and urban environment is directly related to the health of its inhabitants 
  • For example increased demands for transportation and energy create pollution and air quality issues 

Feeding The World: 

  • Causes of world hunger include: natural disasters, conflict, poverty, poor agricultural infrastructure, and over-exploitation of the environment

Food Sources: 
  • Three general sources-crop lands, rangelands, and ocean fisheries 

Two Major Agricultural Systems: 
  • Industrialized agriculture: growth of food using machines and synthetic fertilizers and pesticides 
  • Traditional agriculture: growth of food by hand, using natural fertilizers and pesticides 

Energy Use in the Human Food Web:

  • Energy pyramids: tool that is used by researchers to track the usable energy in a food web 
  • Tropic level: one level of a food web
  • Energy in agriculture can be measured in terms of the energy that goes into producing a unit of food 
  • Another way is to calculate agricultures ecological footprint 
  • Food choices we make as consumers can make a difference 
  • Choosing food sources low on the food pyramid conserves more energy and helps to lessen agriculture's ecological footprint 

Threats to Soil: 
  • Key threats- soil erosion and lost fertility, desertification and salinization (the addition of salt products to the overuse of resources) 
  • Soil erosion-movement of soil components from one place to another 
  • Desertification-occurs when the productive potential of arid or semi-arid land falls by 10% or more because of a combination of natural climate change that causes prolonged drought and human activities that reduce or degrade topsoil 
  • Methods to keep soil moist: irrigation- which involves channeling water to moisten land that does not receive enough rainfall to support agriculture. However irrigation water is a dilute solution of various salts that are picked up as the water flows through soil and rocks, and what is not absorbed leaves a thin crust of dissolved salts in the topsoil.

Sustainable Agriculture:
  • growth of food using less energy and fewer resources than industrialized agriculture uses 
  • Organic agriculture- method of growing food without using synthetic fertilizers and pesticides 

Aquatic Food Sources: The World's Fisheries 


Water Supplies and Demands: 

  • Water is one of our most poorly managed resources 
  • Worlds freshwater supply is continuously collected, purified, recycled, and redistributed in the solar-powered hydrologic cycle 
  • Causes of water pollution: including agricultural runoff, sewage and wastewater, industrial waste, atmospheric deposition, marine dumping, oil pollution and radioactive waste 

Air Quality and Pollution 

  • Atmosphere is polluted by burning fossil fuels, forests, garbage, manufacturing emissions and gases released by livestock
  • Climate Change: continuing rise in the average temperature of Earth's atmosphere and oceans. Caused by increased concentrations of greenhouse gases in the atmosphere, resulting from human activities such as deforestation and the combustion of fossil fuels 
  • Air pollution can cause many health problems 
  • Airborne particles can aggravate respiratory illnesses, such as asthma 
  • Airborne chemicals have also been associated with low birth weight babies and infant lung infections 
  • Ways to curb air pollution- cleaning up industrial emissions, as well as using greener energy sources, burn less gasoline and use less electricity to reduce our global footprint 

Wednesday 13 April 2016

Human Population: Past and Present

Humans have developed the capacity to expand into habitats and climate zones that were once uninhabited and increase the carrying capacity of the environment

Ecological Footprint: impact imposed on the environment by the demand for natural resources

A Brief History: 
  • world grew slowly in response to the density dependent environmental factors, such as availability of food, water, and shelter
  • however world population has increased exponentially 
Demographers have identified four ways that humans have avoided the effects of density-dependent regulating factors:

  1. Expanded Geographic Range: alleviating competition for space. Life has been dispersed 
  2. Increased Carrying Capacity: due to a shift from hunting and gathering to agriculture 
  3. Fossil Fuels: marked the beginning of industrialization
  4. Advances in Public Health: reduced effects of critical population limiting factors such as malnutrition, contagious diseases and poor hygiene
Domestication Of Plants and Animals 
  • increase in agriculture
  • raising livestock- gave food in areas that were not good for producing crops (such as rocky or steep ground)
  • populations were transformed from small mobile-groups of hunter gatherers into societies in permanent towns and villages 
  • these people modified their natural environment through  irrigation and specialized crop cultivation 
  • led to development of food storage practices and technologies, which resulted in surplus food production 
Influence of Science, Technology, and Medicine


Human Demographics
  • demographers often interested in age structure of a population 
  • differences in age structure are a major determinant of differences in population growth rates 
Population Pyramid: tool that shows the distribution of ages among the males and females in a population


Relationship between population growth and economic development in many countries can be represented by the demographic transition model (a diagram that illustrates changes in how people live to explain shifts in population sizes)

Interactions Between Individuals

Interaction between human and animal. 
Coevolution: A process in which one species evolves in response to the evolution of another a species
Herbivory: The interaction between herbivorous animals and the plants that they eat
Mutualism: An interaction in which both partners benefit
Parasitism: An interaction in which one species benefits and the other is harmed
Commensalism: An interaction in which one species benefits and the other is unaffected


DEFENSE MECHANISMS
Mimicry: A form of defence in which one species evolves an appearance that resembles the appearance of another species`


COMPETITION:

  • competition between species
  • competing indv. may experience increased mortality and decreased reproduction
  • two main types of interspecific competition:

Interference Competition: competition in which all the individuals have equal access to resources; the fitness of some individuals is reduced by the presence of others

Example: lions chase smaller predetators such as hyenas, jackals, and vultures from their kills

Exploitative Competition: competition in which all the individuals have equal access to resources; some have superior ability to gather resources

Example: many bird and ant species eat mainly seeds, and each seed-eating species may deplate the food supply that is available to others without necessarily encountering the others

Disturbing Ecosystems Relationships

  • any direct interaction between two species affects not only them but others as well
  • most significant ecosystem disruptions often result from the introduction of a non-native invasive species or the loss of a species
  • habitat destruction for industrialization
  • cause species to become extinct


Changes in Population Size over Time: Modelling Population Growth

NOTE: References to Nelson Grade 12 University Biology Textbook
Population dynamics: The change in a population over time
  • Population is affected by environmental conditions and other regulating factors
  • Because of these species/ environmental conditions, population can change hourly, daily, seasonally, and annually and population may be unpredictable
Population growth rate: the fractional rate at which the number of individuals in a population increases or decreases
  • Refers to the change in a population over a unit period of time
  • Can be calculated as:
(births + immigration) – (deaths + emigration)
Initial population                                                          x100
  • Positive growth rate= increasing population
  • Negative growth rate= decreasing population
  • Growth rate of zero= population is NOT changing
Exponential model of population growth: a pattern of population in which organisms reproduce continuously at a constant rate
  • Humans have the potential for exponential growth
  • Change in population size= number of births – number of deaths
Mathematically…
  • d= “Change in”
  • N= “Population Size”
  • t= “In Time”
  • B= # of births
  • D=# of deaths
Therefore, dN = B – D
                   dt                  ****( first formula on page 601)****
Per capita growth rate(r): the difference between the per capita birth rate and the per capita death rate of a population
  • Per capita birth rate (b) is # of births in the population during specified time period divided by population size:
b= B/N **** SECOND FORMULA ON PAGE 601****
  • Per capita death rate (d) is # of deaths divided by population size:
d= D/N **** UNDER THE TOP ONE ****
Zero population growth (ZPG): a situation in which the death rate and the birth rate are in equilibrium
Carrying Capacity (K): the number of individuals in a population that the environmental resources can support
Logistic model of population growth: a model that describes limited population growth, often due to limited resources or predation
Sigmoid Curve (logistic): an S-shaped curve, typical of population growth that starts slow, accelerates of grows rapidly, and then levels out over time
Additional Information:

  • Mathematical models and graphs help ecologists predict and monitor trends in population
  • Exponential growth and geometric growth models describe population growth when resources are assumed to be unlimited
  • There is an upper limit to the number of individuals that most environments can support. This upper limit is known as the carrying capacity of the population
  • The logistic growth model assumes that the population growth rate cannot be positive when the populations size exceeds its carrying capacity